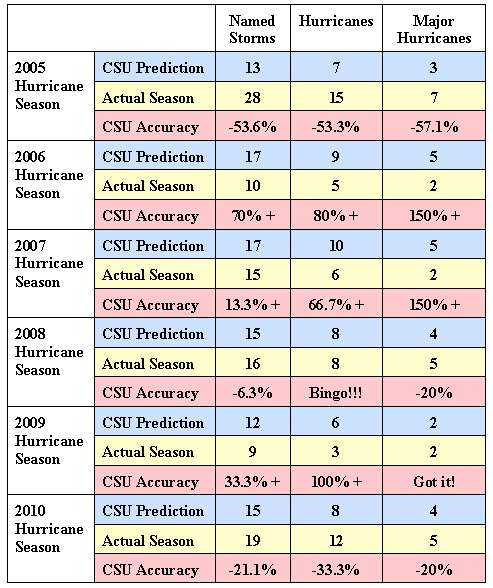
So, as a public service, here, all in one handy chart, are the CSU predictions for the past six hurricane seasons, and the statistics for what actually happened in each season. (The sources for the CSU predictions are the rote news stories that come out each April when they announce their initial predictions; the data for the seasons themselves come from the obsessively-detailed summaries of each season at Wikipedia.)
2005-2010 Hurricane Seasons: CSU Predictions vs Reality

Of course, their predictions are usually not to far off the historic averages, so a 20% error of margin when they predicted four major storms for 2010 and we actually had five belies what you could argue was a pretty good effort.
When these predictions are publicized each year, they are given weight like they have an impeccable, infallible body of evidence and methodology behind them when they’re really what our former mayor C. Ray “School Bus” Nagin called S.W.A.G: a Scientific Wild-Assed Guess. You can see how random some of these "predictions" are by looking at the two years after the 2005 season: after completely under-“estimating” everything about that season, they over-compensated for the 2006 and 2007 seasons and guessed that there would be more named storms, hurricanes, and major hurricanes than actually occurred that years.
The bottom line is only a third of the time are these predictions within a margin of 25% accuracy, and this is for an annual six-month season of fairly well-understood meteorological phenomena. And yet we also give similar weight to other wild-assed predictions of a much less understood phenomena: the cause and effect of variations in numerous factors that may or may not impact global temperatures over the course of the next several decades.


No comments:
Post a Comment